Do you usually overlook adding precious metals to your retirement portfolio? Then you should take a look at some current and historical insight into gold's performance provided by one of our Resources, St. Joseph Partners. The data speaks for itself!

Performance Scorecard
Commentary - May 26, 2020
Many pundits and “experts” on Wall Street are fond of dismissing Gold as an Investment. “No one seriously is involved in Gold anymore”…”Gold is just a shiny rock that one digs out of the ground and sticks in some safe somewhere”…”Gold has no material industrial use and is only good for jewelry, etc.”…”It used to be money, but it isn’t anymore”. However, when actual investment performance is measured, a rather startling track record is displayed. Despite having some long and deep bear markets over the last 50 years, Gold’s performance over the very long run, as well as the short run when markets become chaotic and bearish, is noteworthy. Alternative asset managers looking for “liquid, non-correlated assets” should salivate over the following charts and tables; however, given that the asset in question is Gold, the relative disinterest is astounding.
No matter. The “tale of the tape” can be found below. We believe that the longer this sort of performance is maintained, even the most modern of money managers may be forced to hold their thoroughly knowledgeable noses and buy the asset that has enjoyed a 5000-year run as a reliable, trusted and bedrock portfolio holding.
S&P 500 vs. Gold – From 2/19/2020 all-time high to 5/26/2020
|
|
2/19/2020 |
5/26/2020 |
Performance |
Downdraft Percentage |
| Gold |
$1611 |
$1715 |
+$104 |
+6.5% |
| S&P 500 |
3394 |
2992 |
-402 |
-11.8% |
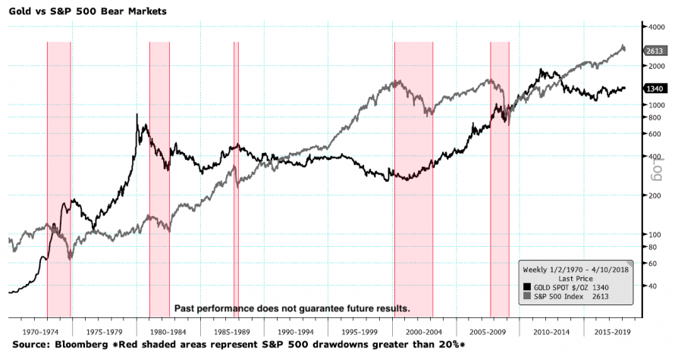
Please note the following graph, which highlights Gold’s performance in Bear Equity Markets since 1971. If one could expand the graph by incorporating the results in the table above, Gold would be shown to have rallied in 5 out of 6 Bear Markets in the last 50 years:
But what about long-term? Once again, the tables below tell the transparent story. Gold’s total return vs. equities (inclusive of adding dividends to Equity’s performance and *subtracting* storage costs from Gold’s) is far superior on both a 50-year and 20-year basis: These time periods are germane given that the former measures the respective performances following the halting of the U.S. Dollar’s conversion into Gold, and that the latter measures the same following the collapse of the “Dot Com” market, the beginning of the ultimate reset of global financial markets:
S&P 500 vs. Gold – 1971 to the Present & 2000 to the Present
|
|
1971 |
2020 |
Dividends |
Storage (0.5% p/a) Return |
Total |
| Gold |
32 |
1715 |
n/a |
-136 |
+4934% |
| S&P 500 |
98 |
2992 |
1288 |
n/a |
+4367% |
|
|
2000 |
2020 |
Dividends |
Storage (0.5% p/a) Return |
Total |
| Gold |
280 |
1715 |
n/a |
-91 |
+580% |
| S&P 500 |
1469 |
2992 |
714 |
n/a |
+252% |
Sponsored Content provided by:
James P. Hunter
St. Joseph Partners